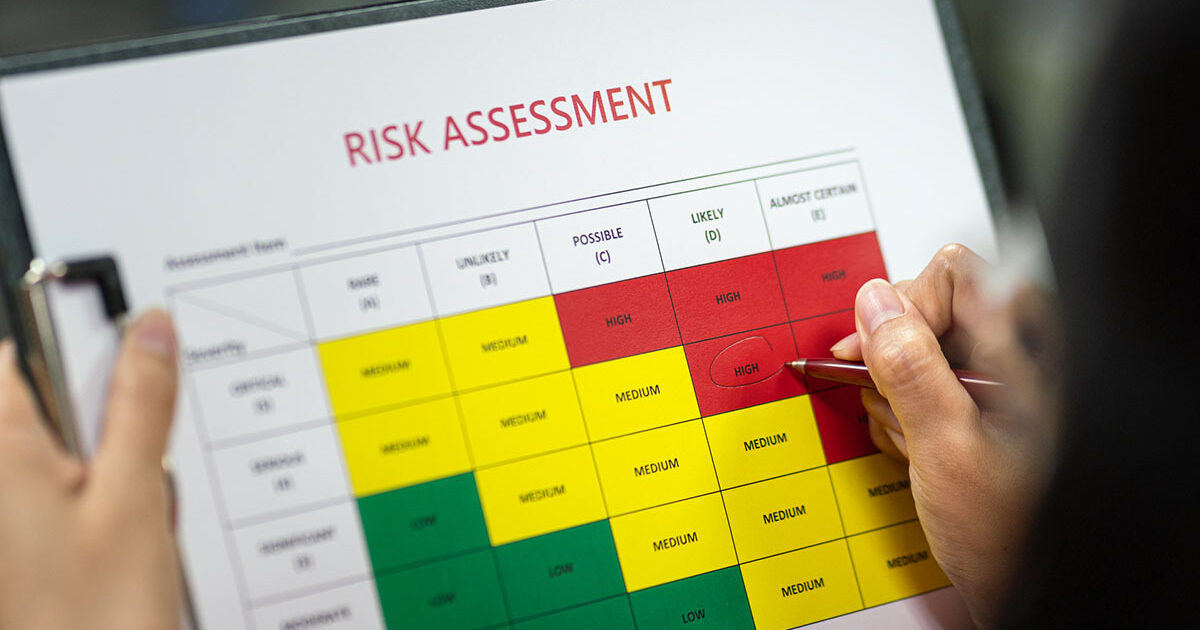
The probability and impact matrix (PI Matrix) is a tool for qualitative risk analysis that lets you rank risks by looking at both how likely they are to happen and how likely they are to have an effect. Using a cardinal or ordinal scale, you specify the probability and effects of every found risk then enter the PI Matrix to obtain the risk rating.
Two fundamental elements of the the probability and impact matrix are “Impact assessment and likelihood”. These tests taken together can help you to determine risk levels. All the risks have been ranked, you split the low-ranking and high-ranking risks and create risk reaction strategies for the former. On the Probability And Impact Matrix, the impact is displayed on one axis—say, low to high—while the probability is plotted on another. Then, depending on their probability and impact, risks are arranged in the matrix so that the risk terrain may be clearly seen.
Read on to know more!
Evaluating the Prospective Risk
Analyzing the possibility of a risk occurrence means grading a risk based on qualitative or quantitative criteria, including frequency or probability over a given period. Based on past data, this evaluation might show the likelihood of an incident occurring during the lifetime of a project or asset or its frequency of occurrence yearly.
Using definitions as follows, the likelihood rating scale falls on a spectrum from 1 to 5:
- 1 = Rare: Occurs less than once in 100 years or has a less than 10% chance of happening.
- 2 = Unlikely: Occurs once in 50-100 years or has a 10-35% chance of happening.
- 3 = Possible: Occurs once in 25-50 years or has a 35-65% chance of happening.
- 4 = Likely: Occurs once in 2-25 years or has a 65-90% chance of happening.
- 5 = Frequent/Almost Certain: Occurs more than once in 2 years or has a greater than 90% chance of happening
Apply this scale to customize the evaluation criteria—such as frequency or probability—to the particular type of risk and its possible causes. This personalized method guarantees a more realistic assessment of the likelihood of the danger.
Determining the Effects of Probability And Impact Matrix Risk
Like likelihood, the effect or outcome of a given event can also be assigned a grade depending on qualitative or quantitative criteria. Impact evaluation might be related to several outcomes depending on the type of Probability And Impact Matrix risk. Their degree of influence on finances, health & safety, security, regulation, operations, reputation, and human resources can also be computed on a 1 to 5 scale.
1 = Insignificant 2 = Minor 3 = Moderate 4 = Major 5 = Catastrophic.
Assessing impact utilizing a mix of elements is an intelligent practice; assign a rating where impact is most evident. Calculating risk is evaluating the possible influence of several hazards and their probability. One must consult several departments and stakeholders to guarantee a thorough evaluation when learning how to evaluate risk.
How To Use A Probability And Impact Matrix ?
List Project Risks
First, you must create a list of possible hazards that can affect your project if you are to make good use of a risk matrix. This stage consists of spotting hazards particular to the scope and aims of your project. Essential factors to consider are:
- Timeline
- Budget
- Resources
- Constraints
Refer to your project scope to generate possible dangerous scenarios influencing your project. If unsure where to begin, think about mind mapping or starbursting to create a complete danger list. Try to classify hazards under each risk type to address every scenario.
Find The Risk’s Degree.
Having your Probability And Impact Matrix in place should help you to create criteria for evaluating risk degree and probability. Use these guidelines now to classify any found danger. Start by assessing every risk’s degree with these questions:
- From this danger, what most severe negative result could occur?
- What possible losses might this risk cause?
- How difficult would it be to recover from this danger?
- From 1 to 5, which degree of severity most fits this risk?
If you can not see the possible seriousness, speak with other project participants to help you to better appreciate the influence of the risk.
Determine Risks’ Likelihood
Once one evaluates the degree of every danger, one may ascertain the likelihood of occurrence. Think through these questions to assess your probability:
- Has this risk past occurred, and if so, how often?
- Do such identical hazards exist that have past occurrences?
- What is the likelihood of this danger developing?
This phase depends on teamwork, particularly concerning related historical initiatives. Work with your team to evaluate the likelihood of every risk so that you may create a more exact risk-reducing strategy.
Determine Risk Affective Power
Sort every danger according to their likelihood and degree of severity ratings on your Probability And Impact Matrix. To ascertain the risk impact, multiply the numbers matching the degree and probability of the danger. For example, the risk impact would be computed as 4 x 4 if a data breach had a likelihood rating of 4 and a severity rating of 4, producing a risk impact score of 16, thus indicating a high-risk impact.
- Give Risks Top Priority And Act Accordingly.
You can now rank each risk by numerical effect score ranging from 1 to 25. Sort your risks according to the highest impact first. Work with your team to decide which of several hazards should be given top attention if their impact score is the same. Create a reaction strategy, including mitigating techniques and preventative actions for handling, should hazards materialize.
Conclusion
Though subjective, qualitative risk analysis is fast. Conversely, quantitative risk analysis is optional and objective, with more excellent information, contingency reserves, and go/no-go judgments; it takes more time and is more complicated. A fundamental instrument for risk control is the Probability And Impact Matrix . It enables project managers to evaluate the likelihood and influence of possible hazards, therefore guiding their decisions, resource allocation, and guarantees of effective project implementation.
Keep an eye for more news & updates on InternalInSider.Com!